What
are agile metrics?
The spirit
of agile development is incremental, ongoing improvement — something that every
agile team wants to embrace. But embracing this idea and implementing it are
two different things. How do you know if your iterations are making an impact?
How can you ensure you are providing more product value to customers
over time?
This is
where both quantitative and qualitative data comes in. Agile metrics
help agile teams set benchmarks, measure against goals, and evaluate
performance. Agile metrics typically assess productivity, predictability,
quality, or value in some way.
The metrics
you choose will vary based on your goals, organization, and development team.
For example, the most common agile metrics for scrum teams are
burndown and velocity — while kanban teams
typically track cycle time, throughput, and work in progress (WIP). But in this
guide, you will also find plenty of methodology-agnostic metrics to choose
from.
Why do
agile metrics matter?
Agile
metrics help you keep a pulse on agile development. By tracking clear
metrics for output, quality, and satisfaction (among internal and external
stakeholders), you can better spot opportunities for improvement.
Predictability metrics also help you plan work with greater accuracy and avoid
guesswork about bandwidth.
Besides
being an effective agile health monitor, agile metrics can help you track
progress towards your goals. It is common among agile teams to establish
performance standards based on agile metrics (which you might refer to as
"agile KPIs"). Agile KPIs offer a quantifiable way to show if you
have improved — and demonstrate your success.
Agile
metrics are often represented in numbers, reports, and charts. But ultimately,
the story they tell is about people. This is important — at the core of
any agile success is the team. Metrics reflect effort, contribution, and
perhaps even tradeoffs you have made in priorities or investments. The right
metrics signal areas of strength and weakness — ideally they should promote
transparency, highlight achievements, and spark conversations on how the team
can improve.
How to
choose agile metrics for your team
In the list
below, we have defined nearly 40 agile metrics — but in practice, you may only
need a handful. Select metrics that clearly map to your goals and that you can
commit to improving as a team. Here are some considerations for choosing which
agile metrics to track:
Metrics
should be clearly defined
It is
difficult to make measurable improvements based on a confusing jumble of
numbers. Make sure the team understands what each metric means and how it will
be tracked.
Metrics
should be comprehensive
Choose a set
of agile metrics that covers a breadth of agile performance — predictability,
productivity, quality, and value.
Metrics
should be evaluated together
A single agile
metric does not paint a full picture. For example, an increasing throughput
metric indicates high productivity on the team — a positive result. But coupled
with a low Net Promoter Score, it is clear that you are not delivering enough
value despite the high volume of completed tasks. Examining these metrics
together provides a more realistic view of your performance.
Metrics
should have assigned ownership
Certain
metrics will be monitored on a leadership or business level while others will
be tracked by your development team. What matters is that each metric has a
dedicated owner to ensure responsibility for reporting is clear.
Metrics
should instigate improvement
Reviewing
metrics is not a passive activity. When you choose to track an agile metric,
make sure to consider how you will actively work to improve on it and how you
will define success.
Metrics
should be trackable Do not commit to complicated metrics without a
reliable way to measure them. Dig in to see if your agile development
tool supports the metrics you want to use.
Metrics
should align with your methodology
Some agile
methods like scrum, kanban and the Scaled Agile Framework®
(SAFe) have built-in metrics — though teams following these methodologies
often track broader business metrics as well. If you do not subscribe to one
agile methodology, you have more freedom to pick and choose the metrics that
make sense for you.
37 agile
metrics for development teams
The list
below includes a wide range of agile metrics for tracking progress,
productivity, and performance — grouped by category and methodology. Think of
it as a compendium, not a prescriptive list, and choose metrics that are
meaningful for your organization and development team.
Agile
business metrics
Many agile
teams use broader business indicators to gauge overall performance and product
quality. While the agile team may not directly own or collect data for these
metrics, they represent the core agile values of customer satisfaction, value
delivery, and flexibility. Following these metrics will help you determine if
your organization is embodying agile principles.
Customer satisfaction score (CSAT) | A broad term that encompasses any survey or question that evaluates customer satisfaction. Generally customers rank their satisfaction with your product or business on a scale (e.g. 1-10 or 1-5 stars). Your CSAT score will be an average of all responses. CSAT is typically owned by company leadership. |
Delivery speed | Average measure of how long it takes the agile team to complete different types of work (e.g. new features or bug fixes). |
Net Promoter Score (NPS) | Based on a single question that asks customers how likely they are to recommend your product to another person — an indicator of quality and value. Answers are submitted on a 0–10 scale from "not likely" to "very likely." NPS is typically owned by company leadership. |
Planned-to-done ratio | Predictability metric that measures the amount of work assigned to an individual or team against the work completed in a given time period. |
Team happiness | Happiness metrics evaluate agile team satisfaction and morale. Similar to CSAT, happiness metrics are often posed as a ranking on a scale. |
Team turnover | Indirect indicator of team happiness. Turnover refers to the rate at which agile team members leave the company and must be replaced. |
Value delivery | Value may seem abstract — but it can be measured along with any other product aspect. Assign value to tasks with money, points, or a scorecard to track how much is completed and delivered to customers over time. Value delivery is typically owned by company or product leadership. |


An example of a product value scorecard
Methodology-specific
agile metrics
Some of the
most common agile metrics you will encounter are related to specific
methodologies like scrum, kanban and SAFe. But metrics like burndown,
velocity, and work in progress are just as popular among teams that do not
follow one specific methodology.
Scrum metrics
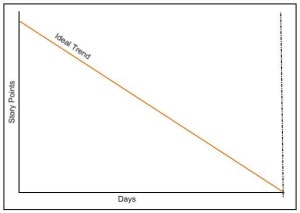
Burndown | Tracks development team progress within the current work period, typically a sprint. Also referred to as "sprint burndown," it shows the amount of work completed against the amount of work remaining — measured in time, story points, or number of tasks. Burndown is represented as a trend line on a burndown chart. |
Velocity | Average amount of work completed in a given time frame, typically a sprint. Velocity helps agile development teams plan sprints, predict future milestones, and estimate a realistic rate of progress. |
Workload distribution | Measure of how much work is assigned to each scrum team member for the current sprint. |
Kanban metrics
Blocked time | Tally of tasks in progress that are reliant on issues or dependencies being resolved — and currently "blocked." Blocked time helps you understand any setbacks that occurred during a work period. |
Control chart | Visualization of the amount of time spent working on different features during a work period — informed by cycle time and lead time. Control charts help kanban teams predict future performance. |
Cumulative flow diagram | Visualization of completed work over time, similar to a burnup chart. Cumulative flow diagrams use color-coding to represent different statuses (e.g., in progress, done, in backlog). |
Cycle time | Time spent actively working on a feature from start to finish, including time spent on reopened issues. Cycle time is one of the most common kanban metrics. |
Lead time | Total time a task exists — from the moment it is created until work is completed. |
Queue length | Number of items in a column on the kanban board. Queue length provides a view of how many items are sitting in each column over time. |
Throughput | A measure of work progress in a given time frame. It is essentially the same as velocity — but is measured by the number of tasks rather than time or story points. Throughput is one of the most common kanban metrics. |
Work in progress (WIP) | Number of tasks that have been started but not completed. WIP is one of the most common kanban metrics. |
Work item age | Time a task has existed from when it was created to the current point in the work period. While cycle time and lead time measure work that has been completed, work item age looks at work still in progress. |


An example of a cycle and lead time report
SAFe metrics
Competency | Complex measurement of the organization's commitment and follow-through on the core competencies of SAFe. |
Flow distribution | Amount of different types of work (e.g. new features versus bug fixes) completed over time. |
Flow efficiency | Measurement of the active and non-active time required to complete tasks. For example, if your flow efficiency is 20%, then work items spend 80% of the time waiting for review, approval, testing, etc. |
Flow load | Total work in progress across all stages — similar to WIP in kanban. |
Flow predictability | Aggregate measure of how well agile teams are able to meet their objectives. |
Flow time | Total time a feature exists from initial creation to customer delivery — similar to lead time in kanban. |
Flow velocity | Number of items completed in a given time period — similar to throughput in kanban. |
Agile
engineering and code metrics
Some agile
teams (especially those practicing DevOps and Continuous Delivery) also
look at code metrics. These engineering metrics give deeper insights into the
technical aspects of quality and productivity.
Code coverage | Number of lines of code that have been covered by your tests, expressed as a percentage (the higher, the better). Code coverage is also referred to as "test coverage." |
Code quality | Measurement of "good" and "bad" quality code. Code quality is subjective and defined by your agile development team. |
Code review time | Time it takes to complete code reviews. As a productivity metric, many teams set goal windows for code review time. |
Defect resolution time | Time it takes to fix identified defects. Most engineering teams set a goal window for defect resolution time. |
Defect density | Number of bugs or defects per 1,000 lines of code. |
Deployment frequency | Measure of how often code is deployed. |
Escaped defects | Number of issues found in a release or deployment after production. A high number of escaped defects can indicate weaknesses in your QA processes. |
Failed deployments | Number of deployments that have failed in a given timeframe — an indicator of code stability. |
Production downtime | Time work spends in the queue while other items are awaiting review, approval, fixes, etc. |
Quality intelligence | Complex metric that helps development teams measure quality and viability of products as a whole and not just what is currently being worked on. |
Release frequency | Measure of how often releases are completed and delivered — similar to deployment frequency but on a less continuous frequency. |
Agile comes
with the promise of a higher quality product, a more dynamic team, and more
satisfied customers — and agile metrics can provide the proof. Select a few to
start, then try adding more or different metrics over time as you explore what
is most meaningful for your team. You will start to see the benefits of your
efforts represented in a tangible way.


No comments:
Post a Comment